Coaches in professional sports have more technology at their fingertips than ever before. In 2018, it is possible to track virtually every aspect of an athlete’s fitness, training and performance. The aim is to put the individual, and ultimately the team, in the best position to succeed. Applied correctly, the advantages can be huge.
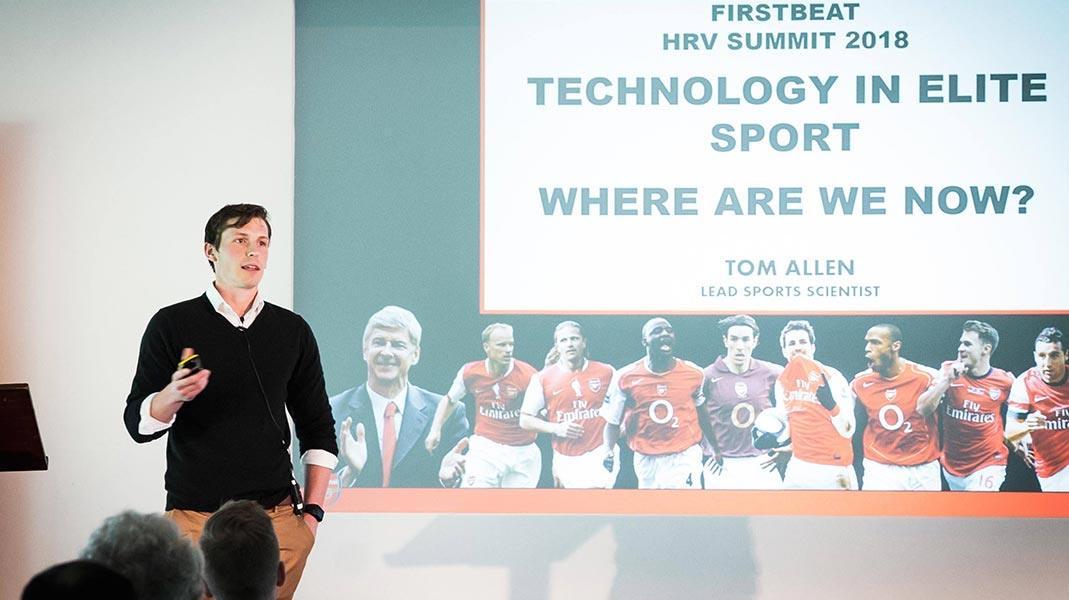
Just how to do this effectively at the elite level was a subject broached by Arsenal Lead Sports Scientist, Tom Allen, at Firstbeat’s recent 2018 HRV Summit.
Influx of Technology
Speaking to a packed room at Lords Cricket Ground in London, the key note speaker recounted football’s evolution from the “who needs technology, we just work hard” philosophy, through to the modern day where Arsenal are using multiple platforms and devices to measure virtually every possible metric in the pursuit of peak performance. “You name something and we’re probably measuring it in some form,” said Allen.
Allen has just finished his first season at Arsenal and his role at the Premier League club involves monitoring and practically applying data into on-field conditioning for the first team squad. He offered an incredible insight into just how this is done at one of the world’s top football clubs.
Using Firstbeat Sports’ heart rate variability (HRV) data alongside GPS, wellness questionnaires and more, Arsenal cover all the bases when it comes to monitoring the squad throughout the season. Inevitably, this level of in-depth analysis means Allen and Arsenal’s support staff receive thousands of data points daily on each member of the team – from Petr Cech to Pierre-Emerick Aubameyang and everyone in-between.
“We need to find a way of collating that information because more technology is being created every single year,” explained Allen. “There has to be a signal we need to find, we don’t just want to be running through loads of data.
“We need to know what our objectives are and how we’re going to decide on the information relevant for the manager.”
Telling a Story
During the 2017/18 season under the guidance of Arsene Wenger – a man who, in 22 years at the north London club, saw the increase in technology within football first hand – those objectives were made clear. “Reduce injury risk and enhance physical performance.”
So, how do Arsenal make sure the manager only receives the relevant information amongst the mass of data that comes from training, gym work and during games?
“We created a database that provides a story for us to tell about a player, and every manager I’ve worked with likes to see the story,” says Allen.
And does it work?
This past season, Arsenal reduced the number of injuries within the squad by one third compared to previous years.”
This particular story centers around stress. Specifically, the five categories of stress that are scored on a 1-5 scale based on the data collected on each individual player. There is; Skeletal Stress (stress on the skeleton through speed/distances). Metabolic (acceleration/deceleration). Cardiovascular (heart rate analysis through Firstbeat variables). Neuromuscular (how the muscles are responding). And Psychological (the athlete’s wellness).
The Process
Each category’s 1-5 score is created by inputting approximately 75 variables into an algorithm. These category scores are then put through another algorithm to produce a single daily stress score. The result? “The individual now has a daily score for how stressed he was today which then goes into a longitudinal database.”
This process allows Allen and his colleagues to see each player’s risk of injury and chance of peak performance at any given time throughout the season. To make this as clear as possible to the manager (and players when shown their own data), Allen and his team create a graph highlighting the load and wellness of each player over time.
“(For load) we take the thousands of different data points from different sources of information like Firstbeat and gym load and we highlight, using a dotted line, when there is statistically significant more stress than previous,” says Allen.
Interested in hearing how TRIMP scores differ depending on positions in soccer? Listen to the Firstbeat Sports Podcast
Scoring above the dotted line is not a cause for concern in isolation. However, if a player ranks above the line for a prolonged period then it signifies overload and may lead to changes in their routine.
Wellness is tracked on the same graph. This is done through 35 measurements largely taken from wellness questionnaires and physical tests and shows how the player is responding to varying loads.
Providing Evidence
Allen revealed one example of such a graph and how it informed them on a player’s situation throughout February 2018.
Stage One – Player is complaining about an ankle issue so training load is reduced. Wellness score also drops as he is reporting more soreness.
Stage Two – By mid-February, there is a gradual increase in load and wellness as player returns to training and game environment. However, due to the high frequency of games at this time, player enters a state of overload.
Stage Three – This overload causes wellness to drop. Under more load and stress there is a reduction in readiness, increase in soreness and reduction in ability to produce movements in screening profile.
With a graph for every player, Allen has at his disposal “a one-page overview that we will give to our performance, medical and management staff highlighting each individual. This provides actionable data for us.”
The PMI System
Arsenal deploy one more tactic to help turn this data into something actionable on the training pitch. The PMI System, named after the three categories within the system, means one of three letters are assigned to each player depending on what the data shows.
P for ‘Protect’ – Individuals who are either at increased risk of injury or in a state of overload. These players would not be pushed physically during training due to overload and poor wellness combination.
M for ‘Maintain’ – Have experienced previous state of overload. Could prolong recovery phase before pushing hard.
I for ‘Increase’ – No state of overload in recent weeks. It is possible to push these players hard due to freshness.
Taking a player in the ‘I’ group as an example, Allen looked at the underlying data. Reviewing the five stress categories, they can design a training plan based around which areas need working on. For example, high speed runs with reduced work:rest ratio are added to the week’s plan for a central defender with low skeletal and cardiovascular stress scores. If work on the neuromuscular category is also required, then these runs would take place when fatigued.
Signal Within the Noise
“We’ve got a lot of information and a really simple way of overviewing players and their current status,” concluded Allen. “But we have to be really careful we don’t take our eye off the ball.”
With technology in sport accelerating at such a rapid rate, an understanding of which data is important, and why, is crucial. This can be done through education and, as we have seen, by putting in place an effective system that pinpoints the data relevant to the ultimate team objectives.
“Practitioners can have all the information in the world but the data itself won’t affect the outcome without building a rapport with people, and your own knowledge of the data,” explained Allen. “That is why it is paramount we’re able to find the signals within the noise and it is people like Firstbeat who can help us do this.”
See the complete presentation slides below:
If you liked this article, you should subscribe to our mailing list.

You might also be interested in

Solving the Training-Injury Prevention Paradox
In August 2017, Firstbeat Sports hosted a special webinar featuring Dr. Tim Gabbett, an internationally renowned physiologist and leading expert on the topics of training demands and injury prevention.

How Loss of Key Player Increases Value of Recovery Data for Tottenham Hotspur
Training load monitoring and recovery testing are among the ways that top teams like Tottenham Hotspur are leveraging science and technology to reduce injuries and create competitive advantages on the field.

How to Gain Maximum Benefits From Your Team’s Winter Break
The break allows the teams to build their strategies, work with their conditioning elements and enables the players to recover from their demanding schedule.

Christoph RottensteinerPh.D., Country Manager DACH, Firstbeat