In my previous blog, Movement Load: Add Valuable Context to Internal Load Data, I discussed the general principles behind Movement Load, what it is, and how it can be used – including a couple of examples.
This time I’m going to take a more in-depth look at how you can use Movement Load and TRIMP to profile your athletes to start understanding more about them and their individual characteristics.
Comparing different players
Firstly, let’s look at the data of two soccer players from the same training session. We can see that Player A on the left has had a higher internal training load for this session when compared to Player B, whether that be assessed by Training Effect, TRIMP (not shown), High Intensity Training minutes, EPOC or just about any other metric you might choose to examine.
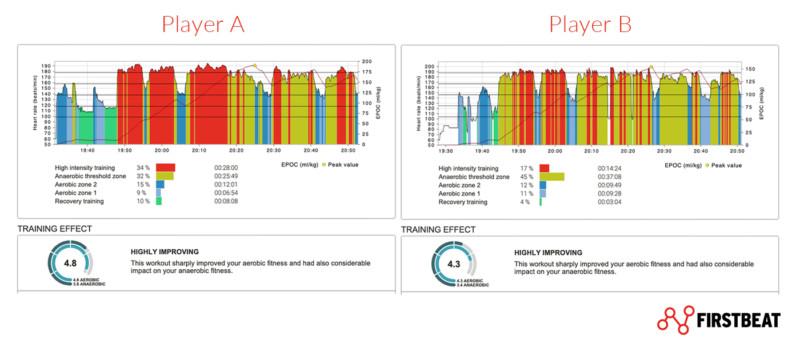
Training Charts for two different players showing data collected from the same session, showing EPOC, Training Effect, and Training Intensity.
What we cannot assess at this point is the ‘why’ as there are a couple of possible answers. Is Player B fitter, or did Player A complete more work? This is where we next look into the external training load for the session using Movement Load.
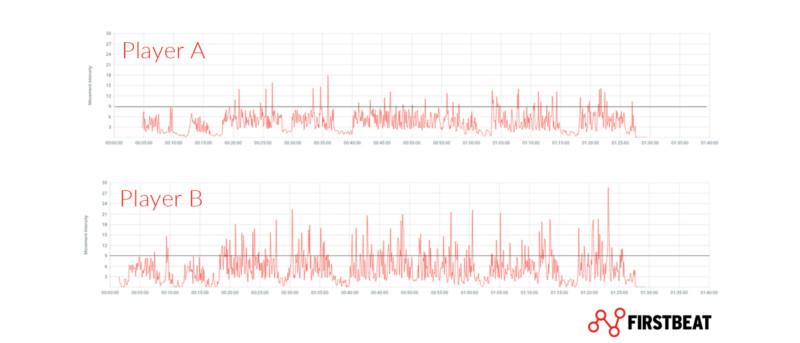
The two charts show Movement Load accumulation for Player A and Player B, respectively.
We can begin to see that Player B has completed more work than Player A as his Movement Load accumulation is higher. For this specific session Player B not only completed more work but also had a lower internal training load, which suggests for this day he was able to better meet the required demands.
What next? The next question we might want to ask is whether this is normal, or has something happened here to cause the difference in performance? Was Player A ill or injured, for example.
Comparing over time
Our next step is to look at the recent trends for the two players to get an idea of their usual training performances, both internal and external. The graphs shown below detail these performances over the six most recent sessions. Player A is shown in grey while Player B is the red line. Of course, the longer time period you can use here the better to get an even more robust idea of what is normal.

Comparing the ML/min, TRIMP/min and Movement Efficiency of Player A vs Player B across the six most recent sessions.
From analyzing these graphs we can see that Player B does indeed normally have a higher Movement Intensity (ML/min) but also a lower TRIMP/min aside from a one-off in session three where this was higher. Movement Efficiency (Movement Load / TRIMP) is also higher for every session for Player B, so perhaps what we have seen from the single session presented at the start of this blog is not so unusual.
Movement Efficiency is a variable you can create yourself using the Data Export feature and calculating it in Excel. It is not currently available within the Firstbeat Sports Cloud Dashboard itself and is just one way of combining internal and external training load data. If you have other methods or combinations that you are using, we’d love to hear about them.
Combining with other data
How can we explain the differences in performance? Let’s have a look at some of the physical performance tests the players completed during their pre-season preparation phases to see if this gives any clues and allows us to further profile each individual.

Results achieved by Player A and Player B in a range of physical performance tests.
By pooling all the different data we have on the two players we can get a much clearer picture of their individual characteristics and begin to understand the training data that they are producing.
Player A is faster over 30m and more explosive, so may have a greater proportion of fast-twitch muscle fibers that fatigue quicker than slow twitch. Conversely, Player B scores lower on those explosive performance tests but does much better on the endurance-focused YoYo Test. This is likely why they do not reach such high %HR Max values during the extended drills because of their superior cardiovascular fitness.
Assessing squad trends
The below graph plots each individual player in the team, their YoYo score on the x-axis, and their average Movement Efficiency on the y-axis. From this, we can see the general trend that those who did better on the YoYo test also display higher Movement Efficiency during their normal training sessions.
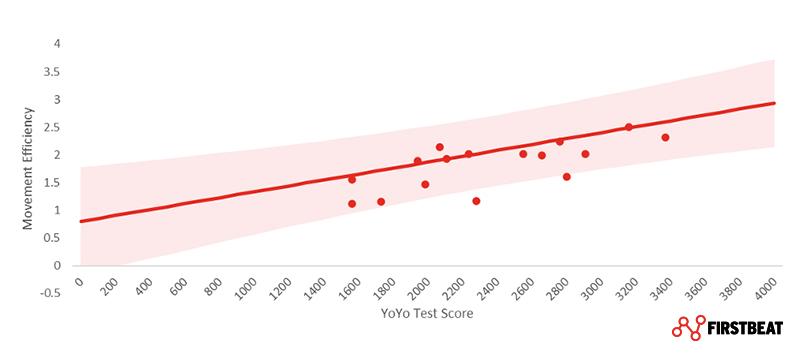
YoYo test scores plotted against movement efficiency.
In my previous blog, I spoke about how using Movement Load alongside TRIMP can allow you to monitor your athletes’ fitness without having to run specific testing protocols. This is extremely beneficial in-season when it can be difficult to get the opportunity to do so.
What we have seen here further supports that idea as we’ve seen that Player B, who performed better on the YoYo Test, consistently had higher Movement Efficiency scores across the period that we examined. Any changes in this over an extended period would help to indicate a change in conditioning, be it positive or negative.
There will always be daily fluctuation as with most internal training load data, but by using rolling averages over an extended period you will get a picture of whether these changes are more sustained or just fall within that daily variance.
Adding context and tracking changes
In summary, adding Movement Load to internal training load can be very powerful as it gives us greater context on each individuals’ performance. It also allows the coach to track changes over time without having to schedule regular testing days, which can be difficult to do during the competitive season.
When we also add other data such as conditioning tests we can see the strengths and weaknesses of each athlete, which, in turn, can be used to plan appropriate training going forward. This could be to address weaknesses or alternatively further enhance existing strengths.
You might also be interested in
Movement Load: Add Valuable Context to Internal Load Data
Movement Load metric allows you to quantify the movement of your athletes using the Firstbeat Sports platform. But what exactly is Movement Load? What should you do with information it…
Interpreting Acute vs Chronic Training Load – A Firstbeat Sports Feature
A comprehensive breakdown of the Acute vs Chronic Training Load feature in Firstbeat Sports.


